Something I have found quite surprising over the last few
months is just how varied archives can be. I was recently given a large set of images to work with, which is not so usual, but the task at hand was trying to look at the items in a new way. This was only
really possible in this case because the dataset I was working with was a group
of digital images, this gives a lot of freedom in regards to quickly arranging
and presenting large quantities of data. Providing our users a
different way of viewing data is in many ways is just like supplying another means
of access, it allows them to see things differently and draw their
own conclusions without imparting any personal bias or inferences on our part.
Tasked with finding free software or tool to use to visualise the material I set about some serious desktop research. Whilst the work is ongoing here are my initial thoughts using two different pieces of software.
 |
| ImageSorterV4 dataset arranged via colour |
ImageSorter
The
first, ImageSorterV4 by Pixolution,
allows a very quick and easy way to sort and arrange large volumes of images.
It is limited in the sorting options available since it can only arrange by
colour, name date and size. Of the choices available colour and date ate the
two that are the most useful for our purposes with the colour option being very
visually striking. The advantage of this program is just how quick it is, within
locating the image folder it will process and display.
 |
| Dataset arranged by Brightness vs Saturation |
ImagePlot
The second program ImagePlot by the
Software Studies Initiative builds upon ImageJ a java based open source image
processor. ImagePlot is a far more versatile program allowing a comparison of
any two elements in relation to the image, providing that you already have
access to the information in advance. At its base it is simply a scatter plot
program, comparing two different values but the way this program differs is
that once it has actually plotted the position it will place the relevant image
at that location. This doesn’t sound ground breaking but it turns a very static
and uninspiring looking scatter graph into a very visual experience. But it is
still just a scatter plot so that means that as long you have two [pieces of
data worth comparing then you can visually display this, so the focus shifts
from looking for the right program to display your data to needing to find the
right way of pulling data from the images themselves.
Metadata
 Since the only information that we have available in this
instance is the image itself we have to look to see what metadata we can extract from the file itself including file size or the date it was created. Most digital cameras also record information at the moment when the
shutter-release button is pressed. Information such as, time and date, camera
model, focus settings, FOV (field of view), was a flash used and in some cameras
it will even record the GPS location of where the photo was actually taken.
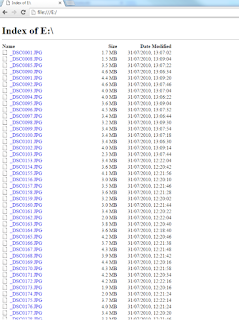
 For my testing purposes using the ImagePlot software I used some easily accessible metadata in the form of name, date last modified and size of the file these I was able to collect in moments by using an internet browser. With files in a folder you can just copy and paste the location address into a browser window in order to get access to a simplified file hierarchy. Google Chrome in particular works well with this.
Image Analysis
 |
| Dataset showing the count of objects vs the percentage area covered |
File Format
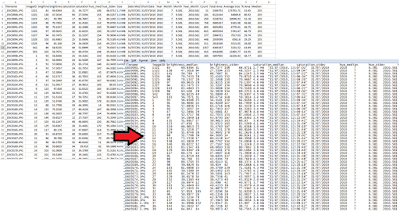
Once all this information has been gathered it simply needs
to be placed into an excel spreadsheet with each row relating to a particular
image. All of the methods I have mentioned so far specifically allow the
information to be retrieved in text form and placed into a spreadsheet very
easily. Once the spreadsheet has all the data that you wish to compare it is
then saved as a tab delineated text file (.txt) which is the format that ImagePlot
uses for running its scatter plot algorithm This freedom of just saving data
into an excel spreadsheet and then turning that into a text files really opens
up what you can do with ImagePlot since as long as you can get information and
values you have something to compare and you don’t have to deal with a third
party file type you’ve never encountered before.
 |
| Conversion of excel spreadsheet to tab delineated text file |
Conclusion
Programs such as these are only limited by the data that can be extracted from the images themselves, the fact that I
can only compare two statistics at a time and the manner that the data is
displayed will always be a direct comparison of one element to another. It is
also far easier to compare information that is pure numbers as opposed to text for example using the file name or any string/boolean value,
although that is only specifically with the software that I have found so far. If there is software that could group
images by textual information I would love to hear about it.
With what I have so far I have a significant amount of information in regards to displaying the data, there are some comparisons that are most relevant than others and some that are far more visually appealing but it is the fact that I can show this data at all that is interesting. Being able to get a visual representation of data makes it easier to consider it as a whole and allows other people to draw conclusions about the entire dataset in a way that would otherwise be almost impossible only viewing small sections of the data at a time.
With what I have so far I have a significant amount of information in regards to displaying the data, there are some comparisons that are most relevant than others and some that are far more visually appealing but it is the fact that I can show this data at all that is interesting. Being able to get a visual representation of data makes it easier to consider it as a whole and allows other people to draw conclusions about the entire dataset in a way that would otherwise be almost impossible only viewing small sections of the data at a time.
David Heelas
Transforming Archives Trainee
No comments:
Post a Comment
Comments and feedback welcome!